DATA ANALYTICS PROJECTS
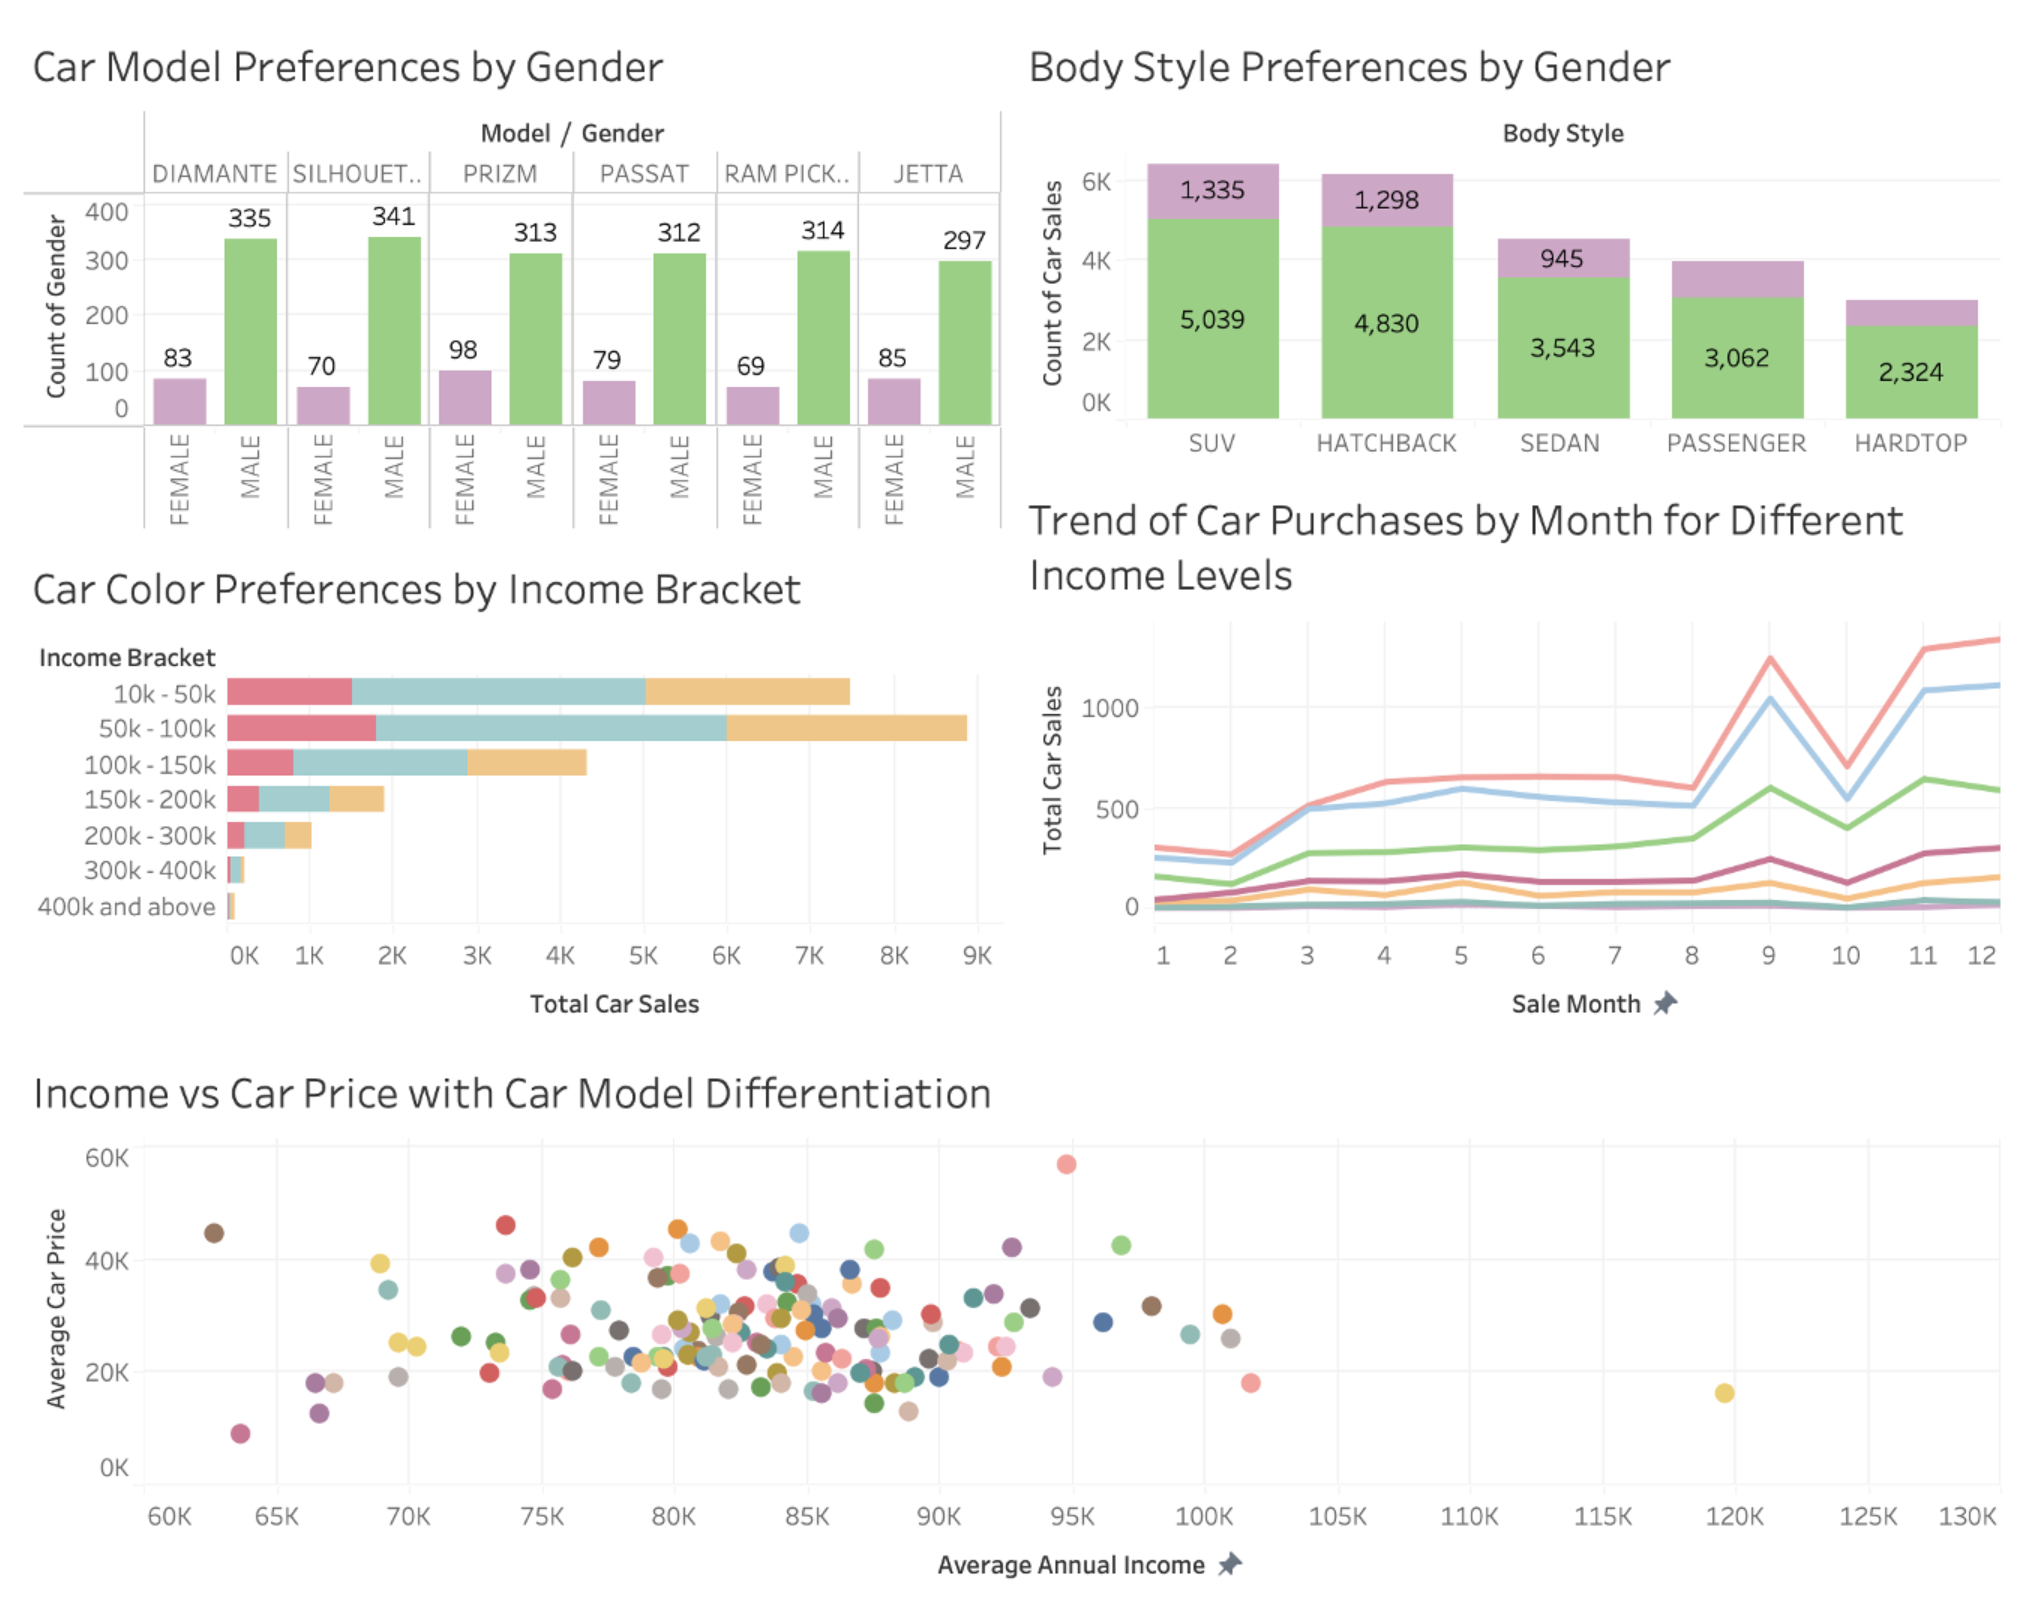
Car Dealership BI System
Led the development of a car dealership intelligence system with an Agile team, using Python, Excel, and Tableau to process 23,000+ transactions, ensure data integrity, and create dynamic dashboards for data-driven decision-making.
Explore Project
Intel Data Center Analysis
Analyzed energy production and consumption data using SQL and Tableau to identify optimal locations for Intel's data center, providing recommendations based on regional energy trends, renewable energy production, and cost efficiency aligned with sustainability goals.
Explore Project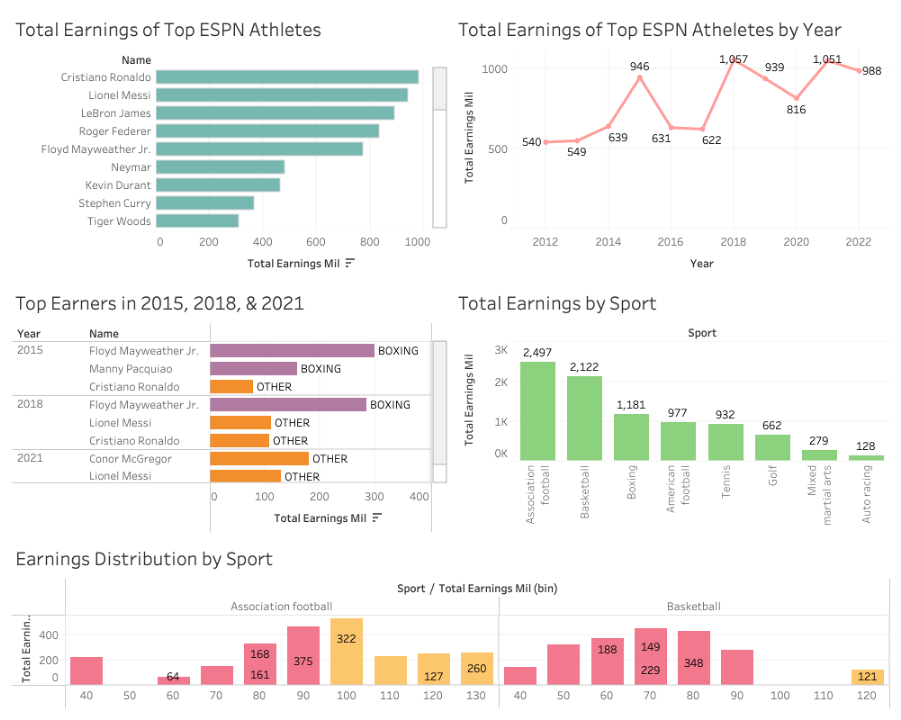
ESPN Top Athletes Analysis
Utilized SQL to extract and analyze data on the top 10 highest-paid athletes from 2012 to 2022, and used Tableau to visualize trends in total, on-field, and off-field earnings across different sports and countries through bar charts, line charts, and histograms.
Explore Project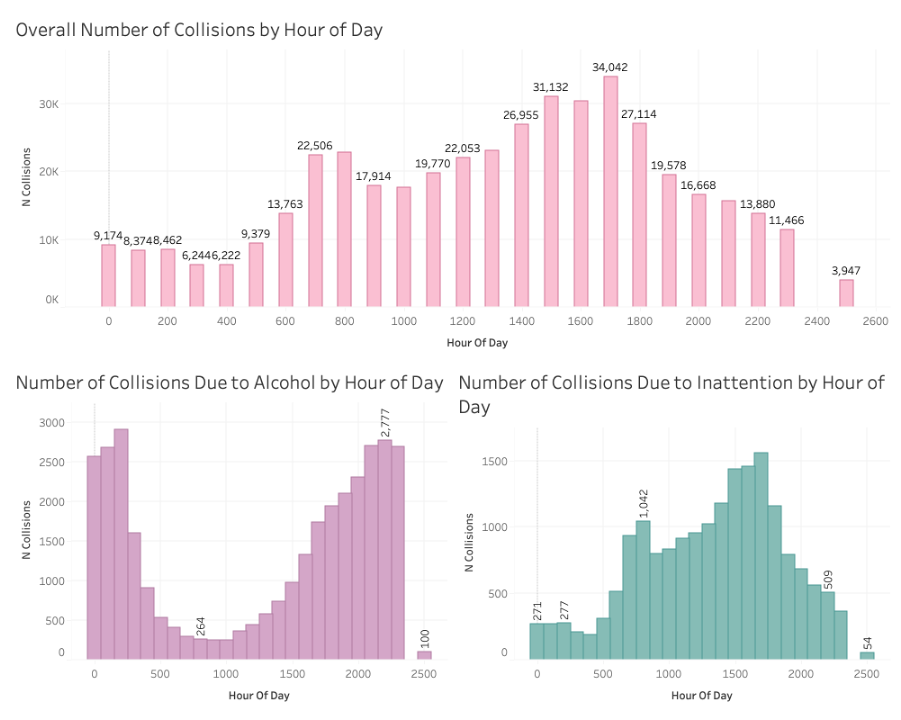
California Traffic Collisions Analysis
Conducted data analysis using SQL to investigate motor vehicle accidents in California, focusing on the influence of alcohol and inattention as contributing factors by joining incident-level and party-level data from the California Highway Patrol’s SWITRS dataset.
Explore Project
MMO Database Implementation
Led the design and implementation of a relational database system for optimizing in-game inventory management in MMOs, using advanced SQL techniques to enforce data integrity, implement business rules, and generate reports on player trading and transactions, while managing project timelines and presenting the solution to colleagues.
Explore Project
The Recording Academy Website Analysis
Performed an in-depth data analysis using Python to evaluate the impact of splitting the Grammy and TRA websites, leveraging Python libraries to identify trends in user engagement, demographic shifts, and audience behavior, ultimately delivering actionable recommendations to enhance digital strategy and optimize website performance.
Explore Project
NASA Planetary Mystery Analysis
Conducted a comprehensive data analysis using Python to explore and visualize weather data from a mystery planet, applying Pandas and Plotly to uncover patterns in temperature, atmospheric pressure, and other key variables to identify the planet.
Explore Project
Olympics Data Analysis
Performed data analysis using Python to explore trends among Olympic medalists from 1896 to 2016, analyzing factors like age, height, weight, and nationality, and comparing performances across sports and between Summer and Winter Olympics.
Explore Project
NYC Public Schools Analysis
Performed data analysis using Python to explore and visualize enrollment patterns, disability rates, English language learners, and poverty levels across NYC public high schools, uncovering key insights to inform educational strategies.
Explore Project
NCAA Data Analysis
Conducted data analysis on NCAA Division I American football teams using Python to explore university nicknames and student enrollments, providing insights into team characteristics and institutional sizes across different conferences.
Explore Project
ASOS Revenue Analysis
Conducted data cleaning and analysis using Python to correct and transform inconsistently formatted revenue data for ASOS, enabling accurate calculation of total weekly revenue and providing insights for business decision-making.
Explore Project
Fresh Monster Market Analysis
Conducted a market demand analysis for Fresh Monster using Amazon activity data, examining customer engagement, sales performance, and product ratings to uncover insights on product popularity and competitive positioning.
Explore Project
Headspace Marketing Analysis
Conducted data analysis on Headspace's marketing performance using Python to explore user acquisition channels, platform usage, and trial periods for both free and premium memberships, providing insights to optimize customer conversion strategies.
Explore Project
Build Up Nepal Project Impact Analysis
Performed data analysis and visualization to assess the impact of Build Up Nepal's campaigns, focusing on key metrics like enterprises established, houses built, jobs created, and CO2 emissions saved, providing actionable insights for stakeholders and community development.
Explore Project
National Park Service Visitation Analysis
Analyzed visitor data for National Parks in Washington D.C., using Python to explore total park visits and monthly trends, providing insights to support a promotional campaign for the National Park Service.
Explore Project
Skullcapz Closed Beta Analysis
Performed data analysis on Skullcapz Studio's closed beta for The Lost Kingdoms, examining player demographics, engagement metrics, and gameplay feedback to provide insights for enhancing game design, marketing, and accessibility.
Explore Project
Construction Job Demand SQL Analysis
Utilized SQL subqueries to analyze construction job data and severe weather events, identifying patterns between weather conditions and job demand to help optimize resource allocation for future projects.
Explore Project
FastKitchen Customer Analysis
Applied SQL outer joins to analyze customer orders and account data for FastKitchen, combining information on registered and guest customers to provide insights into customer behavior and ordering patterns for the restaurant.
Explore Project
London Transportation SQL Analysis
Utilized SQL to analyze passenger behavior data from Transport for London’s Rolling Origin and Destination Survey (RODS), exploring journey patterns on the London Underground based on entry zone, time, purpose, and distance to provide insights into transportation usage.
Explore Project
NBA Statistics SQL Analysis
Utilized SQL to analyze 17 seasons of NBA game data, exploring team performance, scoring trends, and 3-point shooting percentages to uncover strategies employed by successful teams from 2004 to 2020.
Explore Project
Crunchbase Investments SQL Analysis
Utilized SQL to analyze Crunchbase data on startup company investments, exploring funding totals, industry categories, and company status to provide insights for a global venture capital firm’s investment strategies.
Explore Project
Youtube Trending Videos Analysis
Utilized SQL to analyze patterns in views, likes, dislikes, and comments from over 6,300 trending YouTube videos in the U.S. between November 2017 and June 2018, providing insights for content creators to optimize their strategies.
Explore Project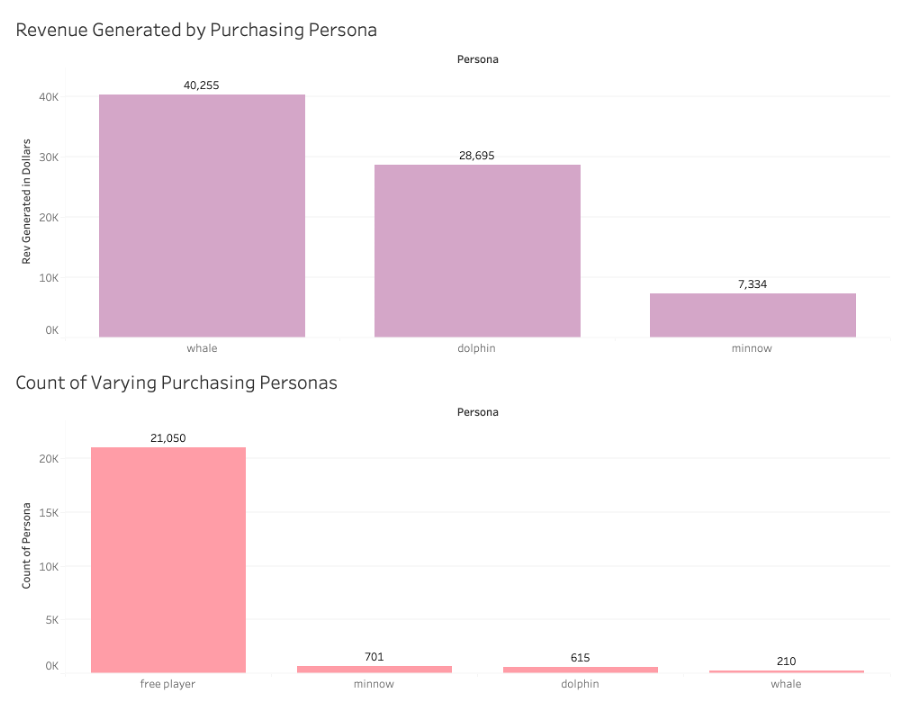
GameJet SQL Analysis
Analyzed app usage data and in-app purchase trends using SQL to help a mobile game company identify patterns in user sessions, monetization strategies, and revenue generation from microtransactions like gems and passes.
Explore Project
Titanic Survival Prediction Model
Built and fine-tuned three predictive models for the Kaggle Titanic Survival challenge, focusing on analyzing the survival rates of females and children. By experimenting with different subsets of data, including variables such as class, age, and fare, I developed models that utilized ML techniques to improve accuracy.
Explore Project
Camera Shop Pricing Model
Developed an advanced pricing model for two substitutable digital SLR cameras by analyzing the interrelationship between price and sales, leveraging a two-way data table in a spreadsheet to identify the optimal pricing strategy that maximizes total revenue, with price variations ranging from $250 to $500.
Explore Project
Cox Electric Decision Model
Developed a make/buy decision model for Cox Electric, constructing an influence diagram and profit calculation formula based on fixed and variable costs, and implemented a one-way data table with goal-seek analysis to determine the breakeven production volume, optimizing for profitability at varying output levels.
Explore Project
Floyd's Bumper Model
Conducted a customer assignment analysis for Floyd’s Bumpers by using Excel functions such as MIN, MATCH, and INDEX to determine the closest distribution center for each customer, and calculated shipping costs for May shipments based on distance, cost per mile, and fuel surcharges using VLOOKUP, resulting in a comprehensive model of total transportation expenses.
Explore Project
Eastman Publishing Model
Developed a comprehensive profit-by-demand spreadsheet model for Eastman Publishing, calculating profit based on fixed costs and variable costs, while testing demand levels. Implemented a sensitivity analysis to assess the impact of varying demand on profit, and conducted a breakeven analysis to ensure precise financial forecasting.
Explore Project
Final Grade Calculation Model
Created an influence diagram and Excel spreadsheet model for calculating final grades, including sections for parameters, assignments, participation, quizzes, and the final project, while implementing color-coded inputs, error checking, and functionality for up to 31 participation entries to ensure accurate grade calculations and a user-friendly interface.
Explore Project
Newton Manufacturing BI Model
Developed a spreadsheet model for Newton Manufacturing using the SUMIF function to calculate total shipping volumes by customer zone and by product model for scientific calculators, providing insights into distribution patterns, and created an influence diagram to visualize the relationships between customer zones and product models.
Explore Project
Prep Air Loyalty Program Knime Analysis
I used KNIME to analyze Prep Air’s Flow Card loyalty program over three weeks, starting with cleaning and restructuring flight data to separate Flow Card users from non-users. I then applied unions, aggregations, and joins to assess pricing trends and performance against sales targets, ensuring data accuracy and calculating key insights for business decision-making.
Explore Project